Monthly Archives: July 2013

State of the Project, Week 7

Did:

  • Got a working Neo4j flare visualization (big intermediate step on the way to getting a tree viz instead of a network!) See my bitbucket page for the code, and a copy of flare.db.
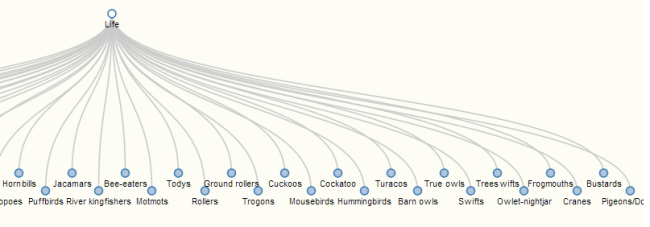
  • Got a working tree visualization of the taxonomy from the bird database. Also exciting, though using taxonomy removes the most difficult part of getting the full tree – having multiple parents and a more web-like structure with conflicts, etc. This is what (part of) the tree currently looks like:

Image

I rotated the visualization to be vertical rather than horizontal, though I haven’t decided which one is more readable. I also added tiers, so all the nodes can fit – and this is still only part of the dataset. Two options would be to either continue adding tiers to fit everything (“life” seems to be an outlier in the number of children it has), or to have another node for “more” that would load the next set of nodes.

Currently, the only major issue left is that when you click on a node, say “Frogmouths,” the viz redraws with Frogmouths as the root node (see below). This is because of the way data gets served to the viz. It works okay for the taxonomy, but needs to be solved before the more complicated phylogeny will work.

Image

  • Began work on the two biggest problems: 1) cutting down on the number of layers of data the viz needs to run, to improve speed, and 2) get the viz to build, rather than to just switch root nodes.
  • Did sketches of alternate viz styles (circular, etc.), and sketches of the bird.db data structure.
  • Uploaded a number of scripts I wrote to my personal bitbucket page. Did clean-up/debugging of all code uploaded; wrote draft of how-to for uploading to bitbucket (which as always, is a little different on Windows. I’ve had the most luck with Tortoise HG).

To do:

  • Solve the two problems listed above
  • Add caching back into the script – only way that building nested jsons (a possible solution for building the viz) will be at all workable. Too much lagging and refetching is going on anyway.
  • Add toggle for common/latin name labels
  • Implement a few alternate viz styles, once problems are fixed
  • Aesthetics of viz (colors for conflicts, resolved/unresolved nodes, etc.)

State of the Project, Week 6

Did:

  • Function map draft of service.py
  • Proofread service.py, gol.js, and index.html
  • Created stripped-down versions of service.py, gol.js, and index.html, to prepare for switching out for different visualizations. Most importantly, removed caching, which makes it easier to make and check changes without having to erase the cache each time.
  • Made the d3 example data, flare.json, into a Neo4j database. By using the same data (albeit as Neo4j, rather than json), this will help with troubleshooting new visualizations.
  • Made stripped-down Phylet version work with local copy of flare.json – hasn’t worked yet with the Neo4j database. I successfully got Neo4j to feed the json I wanted it to, but it’s not visualizing. Put this to the side after some unsuccessful troubleshooting – will pick up again shortly.
  • Did research on phylogenic visualizations and published my summary on this blog.
  • Swapped out the plant database we had been using for a bird database provided to me by Stephen Smith. Began making the database compatible with the Phylet code (by adding child_count, parent_count, etc.)
  • Wrote a Python script to fetch the common names of the species in the database from Wikipedia. After debugging and making some corrections, I stored these as a new property in each node. Also stored whether it was a species/family/order classification, though this particularly was sloppily done for now.

To Do:

  • Restart work on trying to make flare.json work as a database visualization
  • Add functionality to toggle between common name and scientific name labels
  • Create mock-ups of potential design ideas, for feedback.

Visualization research brain-dump

As progress advances in Phylet, I’ve moved into the experimentation phase—looking for alternate visualization styles of the tree of life. The way Phylet is visualized now does a good job of visualizing conflicts—indications that one or more of the source taxonomies do not agree on how nodes relate.  However, its readability is seriously restricted by its unordered format, which dissolves the structure of the tree and leaves a pretty but chaotic visualization. Continue reading

State of the Project (Week 5)

Did:

  • Fixed the problem illustrated in the previous State of the Project post, with the child_count and parent_count properties not being picked up properly. Turns out the database we’ve been using does not have all of the attributes that the db had when Phylet was up online, so these properties were missing. I wrote a script to add them to the Neo4j database, using py2neo, the Python <—> Neo4j translator package. The code:
from py2neo import neo4j, cypher

graph_db = neo4j.GraphDatabaseService("http://localhost:7474/db/data/")

#get rid of all duplicate relationships
def unique(lst, type):
    if type == 'parents':
        parents = []
        for rel in lst:
            enode = rel.end_node
            if enode not in parents:
                parents.append(enode)
        return parents
    else:
        children = []
        for rel in lst:
            snode = rel.start_node
            if snode not in children:
                children.append(snode)
        return children
            
for id in range(0, 3000):
    try:
        #get list of relationships
        my_node = graph_db.node(int(id))
        par = graph_db.match(start_node=my_node, rel_type="STREECHILDOF")
        chil = graph_db.match(end_node=my_node, rel_type="STREECHILDOF")
        #get lst of unique relationships only
        parents = unique(par, 'parents')
        children = unique(chil, 'children')
        #update properties of node on Neo4j
        dic = {}
        dic['stree_children'] = len(children)
        dic['stree_parents'] = len(parents)
        my_node.update_properties(dic)
    except:
        continue

This can also be accomplished using the Neo4j Cypher language, directly in Neo4j:

START n = node(*)
MATCH nodes<-[:STREECHILDOF]-n
WITH n, count( distinct nodes) as stree_parents
SET n.stree_parents = stree_parents

START n =  node(*)
MATCH nodes-[:STREECHILDOF]->n
WITH n, count( distinct nodes) as stree_children
SET n.stree_children = stree_children
  • Pushed up changes to bitbucket repository. This included getting Sourcetree set up and getting a basic tutorial written for it (as always, it is slightly more complicated in Windows than in Mac/Linux). I also refined some of the changes made; the changes in index.html may not be necessary. The site works fine now without these changes, though they did cause issues before.
  • Made the database we are using (named atol.db) available for download through the bitbucket repository. This is a temporary solution – we are looking to switch out this database for a different one soon.
  • Finished draft of tutorial that gets user from beginning to working local version of Phylet, including troubleshooting for the most common problems.
  • Began work on a tree visualization (rather than the current force-directed graph). This is a challenge for me. There are many d3 visualizations available online already, complete with code, but they are all written on the assumption that the data is being pulled from a static json file, rather than a database, and that has not been an easy fix for me, as I am still a newbie to both JavaScript and d3. I am currently using this d3 tree visualization as a model. This code builds off of a nested json file that looks a like this:
{
 "name": "FLARE",
 "children": [
  {
   "name": "analytics",
   "children": [
    {
     "name": "cluster",
     "children": [
      {"name": "AgglomerativeCluster", "size": 3938},
      {"name": "CommunityStructure", "size": 3812},
      {"name": "HierarchicalCluster", "size": 6714},
      {"name": "MergeEdge", "size": 743}
     ]
    },

and so on, and so on, with every node including a list of all of its children, and a list of all that child’s children, etc. Assuming the whole Phylet database cannot be loaded all at once because of its size, this necessitates some fudging here. What I’m currently shooting for is to load a node and all of its children at every click. So, starting with the root node “life,” Neo4j would provide all the information for life, and for all of its children. When the user clicks to expand life, Neo4j feeds all of the information for all of the children of those children, so the data is in essence one step ahead of the visualization. So far, I have not been able to get my code to visualize anything at all, though as always it’s impossible to tell if this is because of the visualization itself, or because a connection is broken somewhere. Currently, I am trying to get the working example tree visualization to work inside the Phylet code – my hope is that I will be able to use this strategy to determine when I’ve fixed all the broken connections.

To Do:

  • Add the static min version of d3 to the bitbucket repo.
  • Continue working on getting alternate visualizations up. My hope is that once I can get one done, doing more will get significantly easier. Current challenges with the tree visualization: even once I get the visualization to work, there may be some problems. Nodes in the Phylet database often have multiple parents, conflicts, etc. that need to be incorporated into the visualization. Nothing in the code I am using now explicitly handles these issues, and I don’t know if it will visualize the multiple-parent issue properly or not. My suspicion is that it will not.
  • Help Gabriel flesh out the website as needed.
State of the Project (Week 4)

Did:

  • (With assistance,) finally determined the cause of the problems I had been having with my local Phylet (the visualization space was empty). Turned out that the Python package py2neo had gotten a major facelift and service.py hadn’t been working as it should. Some problems with the d3 and bootstrap js files were slap-dash corrected.
    Details:
    1.  In service.py, graph_db.get_node() was changed to graph_db.node().
    2. In service.py, my_node.get_related_nodes() was changed to graph_db.match() (note the change from my_node to graph_db). match() also takes different arguments. Py2neo’s .get_properties() is unchanged.
    3. In service.py, the lines adding py2neo to the system path were commented out, as they referred to an old py2neo package and I had it added to my path already. [NEEDS: a more permanent solution.]
    4. In index.html, replaced all <script> pointing back to d3 with a <script> pointing directly to d3.v3.min.js, which is the full d3 min code that I downloaded to my computer. [NEEDS: to refer back to web-based d3, so users don’t have to download?]
    5. In index.html, removed a broken (404) script – bootstrap-popover.js. [NEEDS: a working replacement. A quick attempt at a local copy didn’t work – probably wasn’t even the same script.]
  • Finished drafts of annotations on index.html and service.py – annotations for gol.js have already been completed. Created a simplified function map for how the three pieces work together.
  • Installed Neo4j and Phylet on Ubuntu partition, to flesh out the notes for Linux installation in the tutorial.
  • Defined current obstacle in getting a fully functional visualization. This is what the viz looks like now: little-vizThe blue nodes are “root nodes,” meaning they are unresponsive. Phylet is not getting fed the keys child_count and parent_count correctly – they revert to the default value, 0. By replacing 0 with 10 and 2, respectively (randomly chosen values), the viz becomes responsive and I can expand nodes to show children. Of course, this doesn’t actually solve the problem, but it seems to confirm that this is where the problem lays. Clicking on the node “life” produces this, which is an improvement but still slightly… cluttered:
big-viz

To do:

  • Push edits back to repo on bitbucket.
  • Start work on fleshing out the website.
  • Finish tutorials (up to point I am now).
  • Make the database data we are using available for download.
  • If Phylet becomes fully functional: begin applying alternate visualizations.