Phylet wrap-up

Documentation on how to set up Neo4j and Phylet is here.

All code will be uploaded to bitbucket here by September 23, 11:59 p.m. EST: https://bitbucket.org/cdphelan/opw-phylet/src/0241cb5e64370faed48ec9cbbc4b77f9c2a3ef01/final_phylet?at=default [sorry – WordPress doesn’t like this as a link for some reason]

Debrief:

The Phylet visualization is now deployable as a visualization tool for researchers. It will probably be most useful to those researchers who are at least somewhat comfortable with fiddling with code. I primarily used the bird database (available as atol.db) in my testing, but it appears to be fairly flexible, as long as the database has a few attributes (given below) Phylet has three primary new features: the tree form, the “breadcrumb” visualization option, and the “backwards” visualization option.

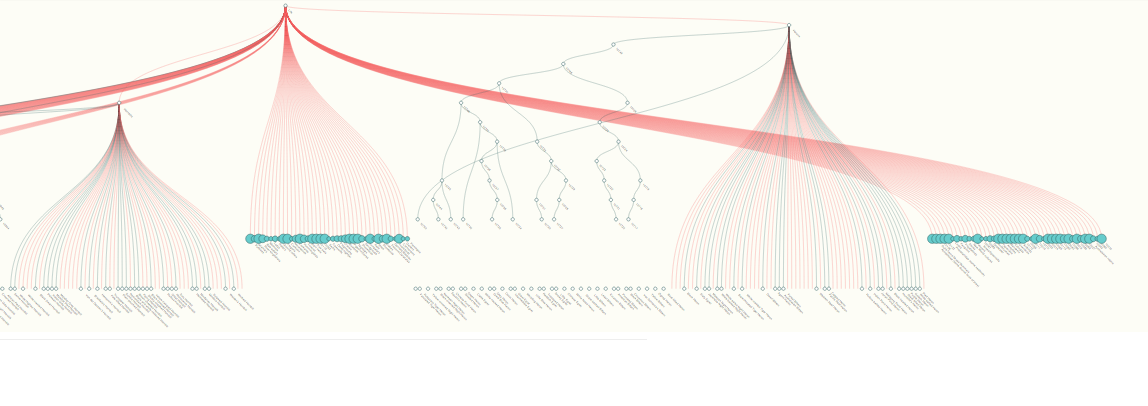
1)   Tree form: the visualization is now hierarchical , rather than the free-form force layout from this spring. All nodes start with the life node and branch downwards to a set level; species nodes drop down to a level below all other child nodes, to help with visual organization. Red links indicate conflict, while teal nodes indicate no conflict; the opacity of the link indicates how many sources agree on that connection. Node size correlates with the number of children it has. (It’s fairly easy to rotate this to open from left to right, rather than top to bottom; there are comments in the code to guide this somewhat. )

2)   Breadcrumb visualization: accessible by right-clicking (or ctrl-click, on a Mac) on a node. In this mode, all expanded nodes collapse except for the clicked node, leaving a single trail from the clicked node back to the root node, Life. One can re-expand any node by left-clicking (with the exception of the bug, see below), or extending the trail by continuing to right-click.

3)   Backwards visualization: accessible by shift-clicking a node. This will prompt a separate visualization to pop up that allows a user to explore all of the clicked node’s parents – the clicked node becomes a root node that opens from the bottom up (rather than top down). This functionality is somewhat limited by the multiple-parents problem (see bug report below).

Overall, the result of my summer of coding is what I’d call an “intermediate deliverable”; it is definitely useful, but its functionality is not as broad as it is intended to be. Originally, the intent was to make a visualization that was accessible to both a scientific and general audience, but some work still needs to be done before it can be used by someone without prior understanding of the data structure, without getting them hopelessly confused. The multiple-parent problem causes the nodes and links to act a little strangely, and the number of nodes that are involved in many of these databases makes the full tree fairly overwhelming, visually.

This is a little disappointing for me, of course; I intended to have a complete, deployable visualization ready by the end of the summer. When I set that goal, however, I had no idea what I was getting into – I knew no JavaScript, let alone d3, and my attempts to set up Neo4j on my own were disastrous. It ended up taking me nearly 3 weeks at the beginning of the summer just to get Phylet up and running locally on my machine, which threw off my schedule for the whole summer. It turned out that my difficulty was almost completely attributable to the fact that I was working on a PC – Neo4j appears to have been developed almost exclusively by Mac users, because the three-step installation process on a Mac takes much longer on a PC and requires a lot of fiddling with the code that is not mentioned in the official documentation. The walk-through that I wrote seems to be one of the only such documents online, and I hope it saves at least a few people the process of blind trial-and-error that I had to go through.

Though the results of this summer are different than I planned (which really, is only to be expected), it was unquestionably an incredibly valuable learning experience and for that, I am so grateful. I intend on pursuing a career in data science and particularly data visualization when I complete my masters’ this May, but before this summer I was limited to static visualizations, and was intimidated by the prospect of tackling a project as complex and with as many moving parts as Phylet does. I knew next to nothing about databases, only slightly more about HTML, and was conversationally fluent in Python, but no other programming languages. D3 and JavaScript are incredibly valuable tools to have in my toolbox, and they were challenging enough that I probably would have never really learned them on my own, unless I was forced to.

Sometimes I feel a little guilty – I got so much out of this experience that I feel like it’s not a fair trade; I could never give back as much as I got. Regardless, it was a wonderful experience and I’m glad I had the chance. Thank you to NESCent, Gnome, and particularly Stephen and Gabe, who were wonderful and supportive mentors.

Technical details:

I kept the visualization within the framework of the original Phylet visualization, but of the sake of simplicity, these are the main places where I made changes:

  • CSS: various mods to nodes/links
  • index.html: uses a static version of d3.min, rather than the ones online; also erased the highlight toggle option
  • service.py: primarily used children() and parents(). In children(), there is a count that artificially limits the number of visible children; when the counter reaches a certain number, the loop breaks. You can comment this out/in to turn it off/on (see the code for details).
  • gol.js: primarily this.start() and update() and the functions they call; of these, the most important ones that I added are trail(), toggle(), toggleOff(), and load_node().

I made no changes to the search or recreateAction functionalities; I believe they don’t work, perhaps never worked, but making them internet-proof is beyond my expertise. I don’t really know how people use search bars to break sites, for instance.

Requirements for Neo4j format:

The service expects several attributes in a Neo4j node:

  • common_name (could easily be replaced with just name)
  • stree_children
  • stree_parents

The scripts for adding all of these, if they are not already in the database, are available on my bitbucket. My scripts are written in Python, but Neo4j’s cypher language can also be used to do stree_children and stree_parents.

Known bugs:

  • Multiple parents: The d3 library is not built to handle hierarchical graphs – graphs that are almost trees but have instances where a single node has multiple parents. As far as I can tell, this challenge has not yet been solved by anyone (at least, not anyone who has posted the solution online), and the kind of d3 hacking involved is frankly beyond my JavaScript and d3 capabilities. All discussion centers around making the d3 force layout (which can handle multiple parents) mimic the tree layout (which cannot). I tried this method, but the result is simply not as good as the tree layout, and the physics of the force layout add a lot of bugs into how the force-tree moves.
  • Losing children in breadcrumb mode: This happens fairly regularly but I’ve not been able to isolate what causes it to happen. When in “breadcrumb” mode, a user should be able to re-expand nodes by clicking on them, but sometimes this doesn’t work – d3 loses the stored children nodes at some point.
  • Window resizing: Minor, but the Phylet website is responsive and dynamically resizes the svg element with the window size; however, the d3 visualization does not resize, which causes the site to look very messy if it’s not exactly the right size. I didn’t attempt to fix this, as I think Gabe has been working on the website look & feel, and didn’t want to fix a problem that may no longer be relevant.
  • Space concerns: Not as much of a problem for the research functionality, so it was a low priority and ended up never getting fixed, but the visualization would be fairly unwieldy for a general audience. The visualization requires a lot of space to open fully – there are just too many nodes in a lot of these databases – but I couldn’t find a solution that made Phylet less overwhelming, visually, without impeding its usability for a researcher. I coded, but did not implement, two potential solutions: artificially limiting the number of children a node can have, and creating an additional “load more” node that, upon being clicked, would load n number of nodes more.
  • Speed concerns: Opening a node with a lot of children takes about 5-10 seconds, which is a pretty big lag if you don’t know what’s going on. I don’t know how fixable this is.

State of the Project, Last week!!

Everything that needs to be done by the end of the project, in various stages of completion:

Coding:

  • Integrate the breadcrumb and backwards tree viz-es into the full visualization (status: debugging)
  • Node spacing concerns (status: several solutions, nothing I’m too excited about; nothing complete)
  • Integrate my viz back into full Phylet site (status: done)
  • Populate data with Wikipedia info (status: initial experimentation only; may not include in final as will be fairly brittle anyway)

Clean-up/administrative:

  • Fully comment code (status: about 60% done)
  • Finish documentation (status: done, just need to make sure it’s somewhere accessible for future)
  • Upload everything to bitbucket (status: to be done the last day)

State of the Project, Week 13

Did:

  • Finished the “breadcrumb” visualization – it is accessed by right-clicking on the node (which I will have to change later, as this is not Mac-friendly). This collapses the visualization down to everything but the clicked node, its children, and a direct line back to Life. I wrote a working version of this using service.py to serve new information back to the visualization, but I ended up scrapping it once I realized I could do everything I needed in the Javascript for d3. Less talking to the server, and faster to toggle nodes open again. Once the multiple-parents problem is solved, this will need to be modified with some additional code to help d3 choose the right parent (rather than a random parent that isn’t even visualized, etc.)
  • Started in on some CSS modifications – I’m trying to clean up the code specifying node size and provide a little more differentiation, but unless you stare at the viz all the time like I do, it’s probably hard to spot the difference.
  • Am working on several different options for space concerns (see below for details) – I’ve been limiting the number of nodes shown in the viz up until now, so I can work on it, but there’s no way to access the rest of the tree at the moment so this obviously has to change.

To do:

  • d3: Polish integration into visualization
  • Python/d3: Space concerns – max out number of nodes shown at a given time? Even with the breadcrumb option, it gets very crowded:
  • Image
  • Other options for space problems: user-specified number of children wanted, or a default zoom-out
  • Debugging: losing children issue in breadcrumb visualization – sometimes nodes lose their stored but invisible children when transitioning from the breadcrumb tree back to normal view. I haven’t been able to replicate this with any consistency
  • Style: nodes and links enter from weird directions sometimes.
  • Style: fiddle with CSS, including colors and node size (minimum is too small at the moment)
  • Style: text placement – currently only a approximation that seems to work pretty well at the moment, but I imagine it’s very brittle
  • d3: Adjust distance between root node and children depending on zoom levels? Currently, the root node and the line of its children seem very far apart when the visualization is first opened, especially if you are unfamiliar with the visualization

State of the Project, Week 12

This week’s theme: clean-up and organization!

Did:

  • Cleaned up my code and re-integrated it into the original Phylet framework – I’d cut out a lot of the toggle-button functionality, etc. when I first started working on the project for simplicity’s sake. It’s still got the multiple-parents bug, so it’s not deployable yet, but at least this will cut down on the work that needs to be done in the future.
  • Wrote a function in service.py that would serve the information for the breadcrumb tree, but now that I’ve finished it, I think that doing the work in GOL.js might be the better option. I’m admittedly still a little fuzzy on how exactly everything talks to each other, but I think the most efficient way of doing this would be to stay with the tree already in memory and just clear out all of the nodes that are not part of the breadcrumb tree, rather than building a new one from scratch. This also would make it easier to keep track of which parent node should be chosen as the breadcrumb.
  • Integrated the backwards tree into the full visualization – there’s still something weird going on here, so I don’t have a screenshot for it yet, but it’s coming along. I think I’m still misunderstanding something about how events work – like shift-click, control-click, etc. – even though it seems really easy. There’s probably just some blasted semi-colon hiding somewhere it is not supposed to be.

To Do:

  • Finish breadcrumb tree & integrate into main visualization
  • Finish integration of backwards tree into visualization
  • Upload clean code to repo
  • Continue investigation into solving multiple parents problem
  • [Optional] – add a pane of information about species using the Wikipedia API – think the results that come up to the side in a Google search if you search something with a Wikipedia article. This is certainly not as essential as the other work, but I’ve done something similar, so if it is as similar as I’m imagining it should be a pretty quick job, and a nice feature that could be added later. We will see!


State of the Project, Week 10

The Dids and the To-Dos are the same this week: continue to work on developing the “backwards tree,” and the “breadcrumb tree.”

Backwards tree:

On right-click, reload a separate viz in a splitscreen with the clicked node as the root node of a tree that shows that node’s parents. Currently looks like this:

Image


This was fairly straightforward – I wrote another function in service.py that would fetch parents instead of children. The most finicky part was changing D3 to open bottom-to-top instead of top-to-bottom, which involved combing through a lot of lines to make sure I’d caught all the references.

Problems:

  • The tree suffers from the same multiple-parents problem as the main tree. As the user expands the tree, the nodes move around, causing all the dead-end links above.
  • Aesthetic concerns: the nodes position themselves a little oddly. Also, would like life to end up in the center of the top of the tree. 
  • CSS bug – “Life” remains filled in so looks clickable

To add:

  • Integrate into the main Phylet viz – open as separate splitscreen viz
  • Change CSS styles to make this graph easily differentiable from the main graph

The multiple parents problem is going to make this graph functionality all but unusable until it gets sorted out, I think. I did more experimentation but still no success on this front.

Breadcrumb tree:

Meant to address space concerns. On control-click, reload the graph to show only the clicked nodes and its children, plus a trail leading back to the “Life” root node.

[IMAGE]

This one is a little tougher – tougher than I first thought, too. There are little snags that complicate things. For example: how do you choose the correct parent to show in the breadcrumb trail, if there are multiple parents? I experimented with keeping a list of recently clicked nodes and giving those nodes priority in choosing a parent to show. A simpler way for now may be to just choose the first one that comes up among the nodes that are already displayed. 

Problems:

  • I wrote the script with TAXCHILDOF relationships being the back-up parent choice, but most nodes do not have a TAXCHILDOF relationship in birds.db
  • I have a strong feeling that I am overcomplicating the process of creating a breadcrumb trail. I’m going to take a detour into researching this, rather than just hacking away at the problem. The avenue I’m going down now seems both inelegant and vulnerable to idiosyncrasies in the structure of different databases. 

To add:

  • Integrate functionality into the main Phylet viz 

State of the Project, Week 9

Screen Shot 2013-08-08 at 11.29.23 AM

Did:

Visualization currently looks like what you can see above. Things I did to get there:

  • Tree can now build, instead of just switching root nodes – this is done by storing the original json in memory and then adding to it as nodes are clicked.
  • Switched from tree to cluster layout, which is essentially the same thing as a tree layout except all the nodes start at a fixed depth. I customized it somewhat, so there are two levels – the species level drops down below all the other nodes.
  • UI changes: LINKS – red links are links that are in conflict with others (meaning, the target node has more than one parent). Teal links are not. Opacity and thickness strengthen as there are more sources that agree on that particular link (though you can’t really see that in the picture above – there aren’t many sources in this particular database). NODES – size depends on the number of children immediately below it. They are filled when they have children collapsed below them, and just an outline when they are expanded or if they have no children. They all shrink to the same size once they are expanded, as well. TEXT – at a 45 degree angle for better readability.
  • Tried and failed to find a solution to the graph/tree problem. The major (i.e., near fatal) problem with this layout is that cluster and tree layouts are hierarchical, meaning that they allow only one parent. As the tree is properly a graph (multiple parents and children) instead of a tree (directed with only one parent to each child), this poses a much more serious problem than I first thought. There is not really a solution to the problem, at least not one that is feasible for a Javascript/d3 beginner like me to accomplish. I spent about four days researching possible solutions with little progress.
  • Tried and ultimately abandoned a force directed “tree” graph layout, which was the only solution I could find in any detail about dealing with the multiple parent problem. Though impressive technically, quite frankly, it is ugly (see example here) and just doesn’t stand up to the way that d3 can pull off a cluster layout.

It was determined that the original cluster layout would be more useful, even with the multi-parent bug, and is something that could be tackled later by someone with more Javascript chops.

To do:

  • Make a “backwards tree” split screen – a tree with the leaf node as the root, going backwards to the parents, that pops up with a double click
  • Space efficiency – reload tree with right-clicked node as root, with addition of the path back to “life.”

State of the Project, Week 7

Did:

  • Got a working Neo4j flare visualization (big intermediate step on the way to getting a tree viz instead of a network!) See my bitbucket page for the code, and a copy of flare.db.
  • Got a working tree visualization of the taxonomy from the bird database. Also exciting, though using taxonomy removes the most difficult part of getting the full tree – having multiple parents and a more web-like structure with conflicts, etc. This is what (part of) the tree currently looks like:

Image

I rotated the visualization to be vertical rather than horizontal, though I haven’t decided which one is more readable. I also added tiers, so all the nodes can fit – and this is still only part of the dataset. Two options would be to either continue adding tiers to fit everything (“life” seems to be an outlier in the number of children it has), or to have another node for “more” that would load the next set of nodes.

Currently, the only major issue left is that when you click on a node, say “Frogmouths,” the viz redraws with Frogmouths as the root node (see below). This is because of the way data gets served to the viz. It works okay for the taxonomy, but needs to be solved before the more complicated phylogeny will work.

Image

  • Began work on the two biggest problems: 1) cutting down on the number of layers of data the viz needs to run, to improve speed, and 2) get the viz to build, rather than to just switch root nodes.
  • Did sketches of alternate viz styles (circular, etc.), and sketches of the bird.db data structure.
  • Uploaded a number of scripts I wrote to my personal bitbucket page. Did clean-up/debugging of all code uploaded; wrote draft of how-to for uploading to bitbucket (which as always, is a little different on Windows. I’ve had the most luck with Tortoise HG).

To do:

  • Solve the two problems listed above
  • Add caching back into the script – only way that building nested jsons (a possible solution for building the viz) will be at all workable. Too much lagging and refetching is going on anyway.
  • Add toggle for common/latin name labels
  • Implement a few alternate viz styles, once problems are fixed
  • Aesthetics of viz (colors for conflicts, resolved/unresolved nodes, etc.)

State of the Project, Week 6

Did:

  • Function map draft of service.py
  • Proofread service.py, gol.js, and index.html
  • Created stripped-down versions of service.py, gol.js, and index.html, to prepare for switching out for different visualizations. Most importantly, removed caching, which makes it easier to make and check changes without having to erase the cache each time.
  • Made the d3 example data, flare.json, into a Neo4j database. By using the same data (albeit as Neo4j, rather than json), this will help with troubleshooting new visualizations.
  • Made stripped-down Phylet version work with local copy of flare.json – hasn’t worked yet with the Neo4j database. I successfully got Neo4j to feed the json I wanted it to, but it’s not visualizing. Put this to the side after some unsuccessful troubleshooting – will pick up again shortly.
  • Did research on phylogenic visualizations and published my summary on this blog.
  • Swapped out the plant database we had been using for a bird database provided to me by Stephen Smith. Began making the database compatible with the Phylet code (by adding child_count, parent_count, etc.)
  • Wrote a Python script to fetch the common names of the species in the database from Wikipedia. After debugging and making some corrections, I stored these as a new property in each node. Also stored whether it was a species/family/order classification, though this particularly was sloppily done for now.

To Do:

  • Restart work on trying to make flare.json work as a database visualization
  • Add functionality to toggle between common name and scientific name labels
  • Create mock-ups of potential design ideas, for feedback.

Visualization research brain-dump

As progress advances in Phylet, I’ve moved into the experimentation phase—looking for alternate visualization styles of the tree of life. The way Phylet is visualized now does a good job of visualizing conflicts—indications that one or more of the source taxonomies do not agree on how nodes relate.  However, its readability is seriously restricted by its unordered format, which dissolves the structure of the tree and leaves a pretty but chaotic visualization. Continue reading